TEAM BRAD WINS!
The path to their $1 million victory wasn't easy, and every player made their mark. LOOK BACK
All-Stars Games
Jeopardy! All-Star Games Presented by Consumer Cellular
$1 Million Champions
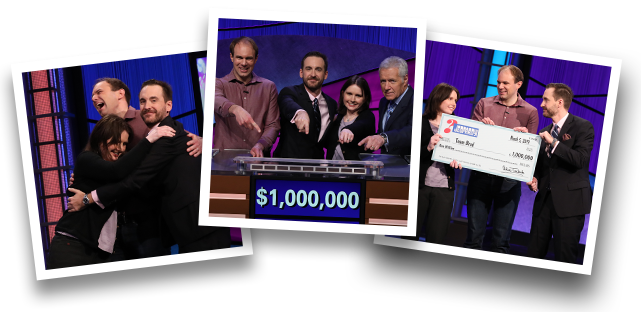
Team Brad
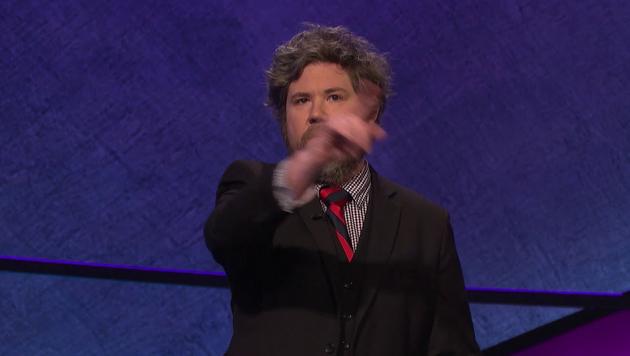
See Austin's Video
Los Angeles, California
- Highest all-time winnings (over $4.3 million)
- Has never lost to a human
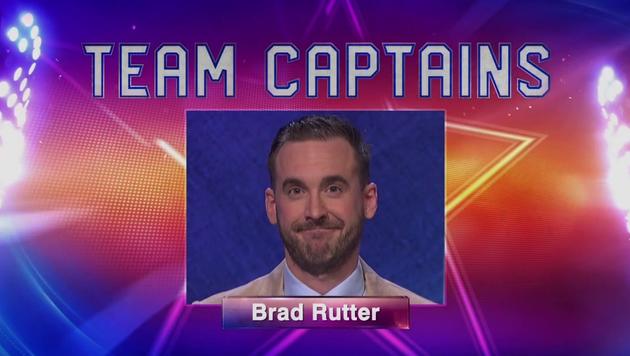
See Brad's Video
Los Angeles, California
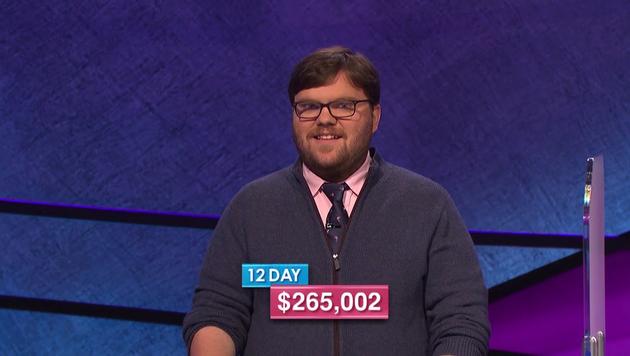
- 9-game champion
- 2017 Tournament of Champions winner
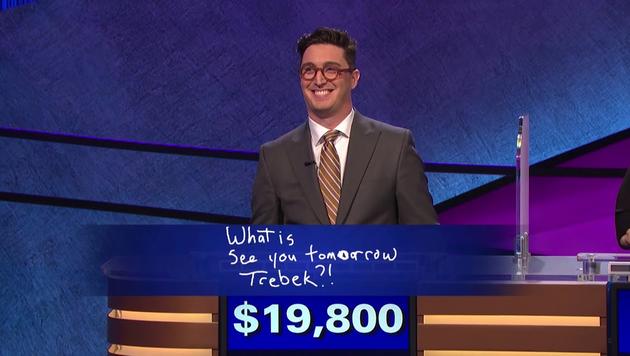
See Buzzy's Video
Chicago, Illinois
- 2012 Teachers Tournament winner
- 2013 Tournament of Champions winner
See Colby's Video
See Julia's Video
Seattle, Washington
- 74-game champion with longest winning streak
- Total earnings over $3.4 million
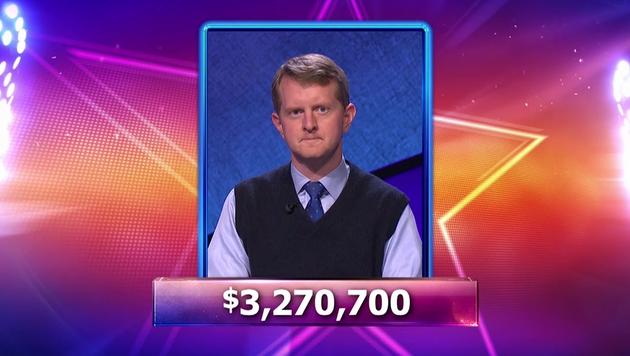
See Ken's Video
Riverside, California
- 6-game champion
- 2017 Tournament of Champions runner-up
See Alan's Video
Greensboro, North Carolina
- 6-game champion
- 2015 Tournament of Champions winner
See Alex's Video
Lake Wylie, South Carolina
- 8-game champion
- 2014 Tournament of Champions winner
See Ben's Video
See David's Video
Longmont, Colorado
- 2015 Teachers Tournament winner
- 2015 Tournament of Champions quarterfinalist
See Jennifer's Video
Richmond, California
- Top 10 regular season winnings
- Co-founder of National Academic Quiz Tournaments
See Larissa's Video
Little Rock, Arkansas
- 2013 Teen Tournament winner
- Graduated from Brown University
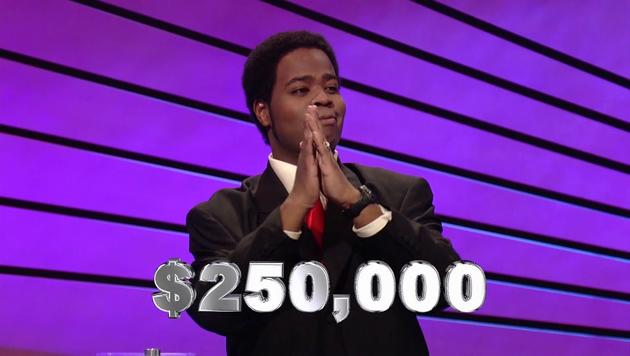
See Leonard's Video
See Matt's Video
New York, New York
- 2012 College Championship winner
- 2013 Tournament of Champions quarterfinalist
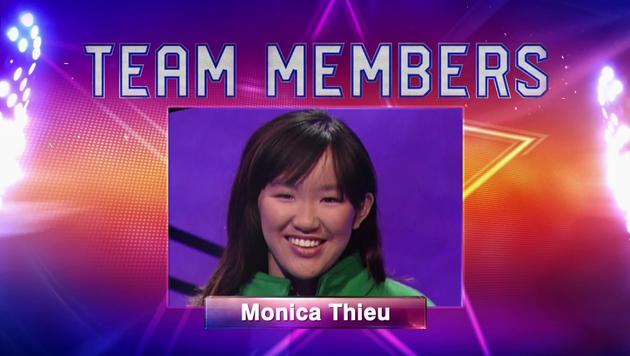
See Monica's Video
Culver City, California
- 2000 College Championship winner
- Semifinalist in all other tournaments
See Pam's Video
See Roger's Video
See Seth's Video

All-Stars Insider with Jimmy McGuire
Live interviews, strategy sessions and more. See the game as you’ve never seen it before!
Consumer Cellular® The All-Stars in Wireless
See The All-Star Players' Stats
X
PAST GAMEPLAY STATS
Click on the column header to sort.
Does not include results from the All-Star Games. Number in parenthesis denotes ranking amongst the All-Stars contestants.
| Player Sort descending | Average First Ring-Ins Per Game [1] | Percent of Correct Responses [2] | Percent Correct of Final Jeopardy! | Average Daily Double Wager | Average Final Jeopardy! Wager | Percent of Runaway Games | Average Winning Score |
|---|---|---|---|---|---|---|---|
| Alan Lin | 19.5 (13) | 89.6% (12) | 64% [7/11] (8) | $3,273 (8) | $4,610 (14) | 27% [3/11] (12) | $17,774(13) |
| Alex Jacob | 25.4 (3) | 91.6% (7) | 27% [3/11] (18) | $4,694 (4) | $4,431 (15) | 73% [8/11] (2) | $24,451(5) |
| Austin Rogers | 22.2 (8) | 88.3% (13) | 82% [14/17] (4) | $4,842 (3) | $9,885 (2) | 47% [8/17] (5) | $28,315(2) |
| Ben Ingram | 18.8 (15) | 92.8% (2) | 92% [12/13] (2) | $2,648 (11) | $4,418 (16) | 23% [3/13] (14) | $20,621(9) |
| Brad Rutter | 23.5 (5) | 91.2% (10) | 59% [16/27] (10) | $2,121 (14) | $5,149 (10) | 37% [10/27] (9) | $17,397(14) |
| Buzzy Cohen | 19.5 (12) | 86.5% (15) | 57% [8/14] (11) | $2,745 (10) | $5,722 (6) | 29% [4/14] (10) | $19,379(10) |
| Colby Burnett | 18.4 (16) | 92.2% (4) | 55% [6/11] (13) | $1,547 (18) | $2,848 (18) | 18% [2/11] (15) | $16,970(15) |
| David Madden | 21.4 (10) | 91.8% (6) | 73% [16/22] (5) | $1,804 (17) | $3,614 (17) | 50% [11/22] (4) | $21,441(7) |
| Jennifer Giles | 19.2 (14) | 87.6% (14) | 60% [3/5] (9) | $2,250 (12) | $4,840 (12) | 40% [2/5] (8) | $13,160(18) |
| Julia Collins | 21.3 (11) | 91.9% (5) | 56% [14/25] (12) | $2,227 (13) | $5,236 (9) | 44% [11/25] (7) | $18,628(12) |
| Ken Jennings | 33.0 (1) | 91.4% (8) | 66% [56/85] (6) | $3,815 (7) | $7,393 (5) | 79% [67/85] (1) | $31,627(1) |
| Larissa Kelly | 22.6 (6) | 92.4% (3) | 83% [10/12] (3) | $4,078 (6) | $10,567 (1) | 16% [2/12] (16) | $27,233(3) |
| Leonard Cooper | 22.0 (9) | 85.6% (17) | 50% [2/4] (16) | $18,000 (1) | $8,050 (3) | 25% [1/4] (13) | $22,650(6) |
| Matt Jackson | 24.6 (4) | 96.2% (1) | 50% [9/18] (14) | $4,672 (5) | $5,523 (8) | 67% [12/18] (3) | $26,417(4) |
| Monica Thieu | 17.0 (18) | 80.4% (18) | 100% [5/5] (1) | $1,933 (16) | $5,600 (7) | 0% [0/5] (17) | $15,400(17) |
| Pam Mueller | 17.9 (17) | 90.0% (11) | 43% [6/14] (17) | $2,769 (9) | $5,085 (11) | 0% [0/14] (18) | $15,401(16) |
| Roger Craig | 25.9 (2) | 86.2% (16) | 50% [8/16] (15) | $6,350 (2) | $7,752 (4) | 44% [7/16] (6) | $19,360(11) |
| Seth Wilson | 22.5 (7) | 91.3% (9) | 64% [9/14] (7) | $2,035 (15) | $4,743 (13) | 29% [4/14] (11) | $20,672(8) |


